In the last few posts we explored frameworks understanding and aligning firm performance with expectation of investors (Economic Value Added (EVA)) and customers (Customer Value Added (CVA). We also considered a few alternative frameworks relevant for the employee stakeholder and concluded that a framework for employee engagement like Great Place to Work might be a suitable candidate. Now that we have these frameworks let’s see how we can integrate them into a broader overarching framework. One way to do this might be to adapt one with which we are already familiar, i.e. the balanced scorecard (BSc).
We have looked briefly at the BSc framework before, first at how it has evolved and comparing it with Business Performance Management, another framework. It may help to do a quick recap. The BSc represents business strategy in the form of a strategy map. The strategy map, as shown in the illustration below from the article in Harvard Business Review in July-August 2007, is a set of causal relationships linking intangible assets, business process performance, customer outcomes and financial performance. Another way to represent the strategy map is in the form of four bands, with intangible assets at the bottom and financial performance at the top.
The Balanced Scorecard Strategy Map (Kaplan & Norton, HBR, July-August 2007)
There are a couple of issues with the way the stakeholders of the organisation are represented in the framework. First, there is an underlying assumption that eventual outcome is financial performance, that everything the organisation does is designed to deliver this outcome. This is not aligned with the mission of the typical organisation, which is generally stated in terms of what the organisation does by way of meeting the expectations or needs of a certain group of customers. For the BSc framework to be fully aligned with the organisation’s vision, the band representing customer outcomes would need to be at the top, not below financial performance. Second, the employee isn’t represented here as a stakeholder with expectations the organisation needs to meet. The employee sits at the very bottom of the causal map.
How would we adapt the BSc framework to reflect the expectations of investors, customers and employees, the three key stakeholders we have considered thus far?
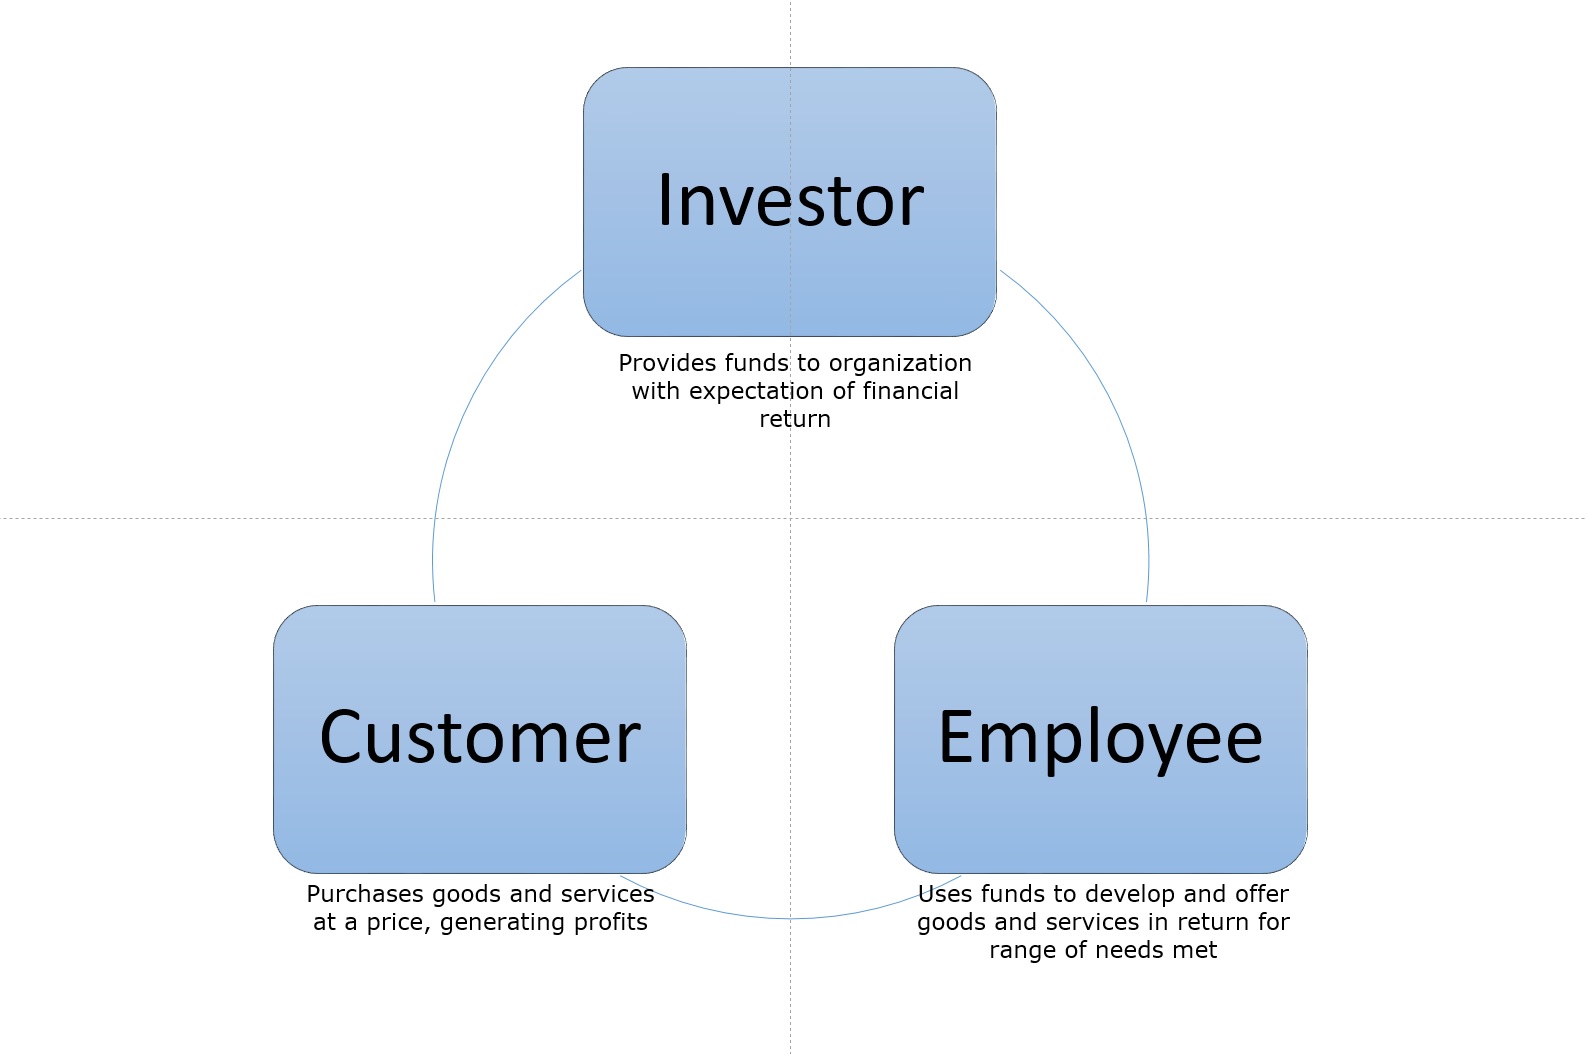
The first step is to represent the expectations of these stakeholders towards the organisation in the form of a causal chain. One way to do this would be as follows. Investors provide the funds to the organisation. Employees use the funds made available to develop and offer goods and services to customers. Customers, by purchasing goods and services at a price, provide profits that meet the return on investment expectations of investors. This virtuous cycle is illustrated below.
Meeting Stakeholder Expectations: The Virtuous Cycle of Value
The next step is to build in the measures of performance that would meet stakeholder expectations. This would translate for investors into an acceptable risk-adjusted return on their investment usually represented by the term Total Shareholder Return (TSR). TSR would consist of a number of components, but for now let’s consider just two: periodic dividends and share price appreciation. We could translate the targeted values for these two components into the equivalent Economic Value Added (EVA) target and thence to conventional profitability measures like EbIT.
For the customer stakeholder we could target a certain market share aggregated over the range of products of services. To achieve the target, we would translate market share into a certain point on the Value Added Relative to the Competition (VARC) equivalence curve. We would need to position ourselves sufficiently away from the curve such that the value added is more than the total cost of using the product of service. We also need to position ourselves such at that we are further away from the curve than our main competitors.
For the employee we could set a goal in terms of the relative attractiveness, compared to the rest of the industry perhaps, to a prospective employee and measure it using one of the several engagement frameworks.
The content of this part of the framework, i.e. the articulation of what this means for the stakeholders, is the mission statement, the organisation’s raison d’être. Once we establish the target values for the measures of performance in respect of the three stakeholders, we have a clear and precise statement of the organisation’s vision, a view of what the world will look like once the targets are achieved.
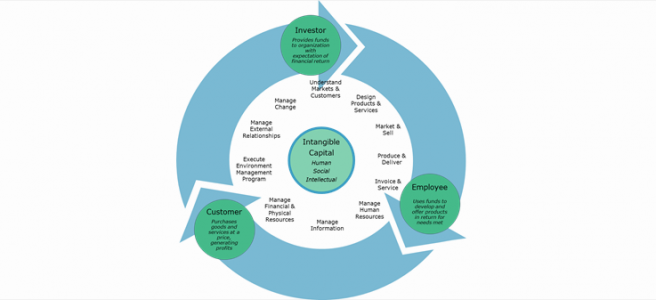
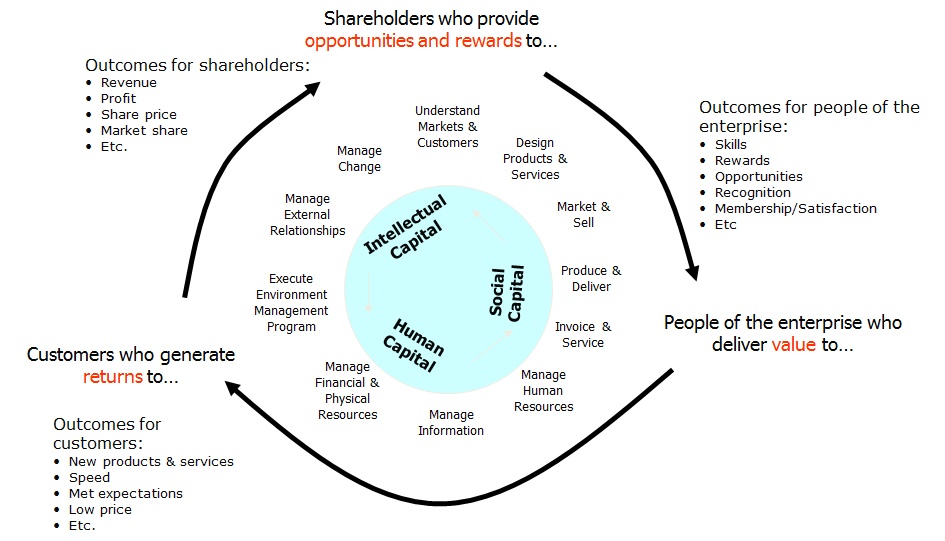
We can now build the rest of the framework and for this we can use the two lower bands of the original balanced scorecard. The organisation has a set of processes that it must execute at a certain level of performance for the stakeholder targets to be met. And to do this, the organisation must leverage its intangible assets, i.e. its human capital (people skills and knowledge), social capital (culture and the way employees live it) and intellectual capital (the formalised knowhow the organisation possesses).
Updated Version of Balanced Scorecard
What we done is to put together a generic framework that is aligned with expectations of stakeholders. This is not necessarily the best or even the only framework one can use. And that caveat goes to the heart of working with complex adaptive human systems. There isn’t a single universal framework that will work in all situations. What one has to do is pick one that looks like the closest fit and start using it, engaging in ongoing learning and adjusting it with new insight or as new information comes to hand.
In the next few posts we will look at how we can engage in this learning process.
If you are interested in learning more about organisational alignment, how misalignment can arise and what you can do about it join the community. Along the way, I’ll share some tools and frameworks that might help you improve alignment in your organisation.